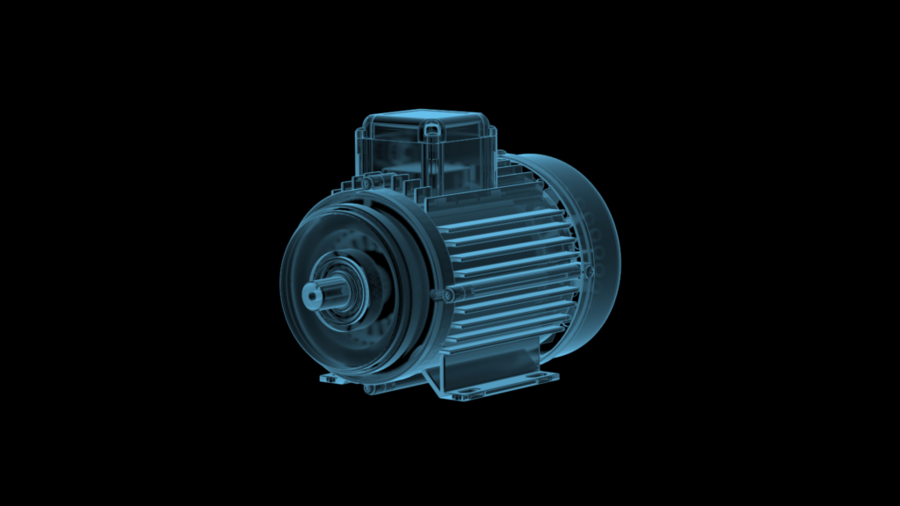
For the testing of these e-drives, we implemented the data acquisition solution and evaluation for a large German automotive supplier. Power consumption and speed are relevant to evaluating the efficiency of electromechanical systems. Since the motors are permanently installed into vehicle body parts, often only the electrical current and voltage signals are all that’s available for quality testing.
Using the Current Signal to Determine Motor Speed
In a classic DC motor, the mechanical commutator leads to a brief drop in the current curve when poles are reversed. Depending on the design and number of poles of the motor, the quantity of current dips corresponds to one revolution. This model is also reflected in the current curve of brushless motors with electronic commutation.
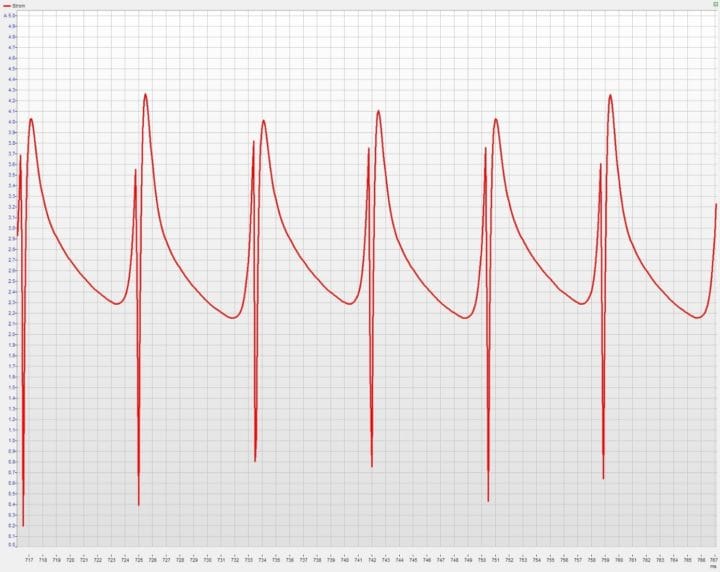
Figure 1 demonstrates the current curve of a motor over time. The current pictured here was measured with a Q.bloxx XL A107 I/O module and a shunt. The current drops visible in this example occur during commutation at intervals of 8.4 ms.
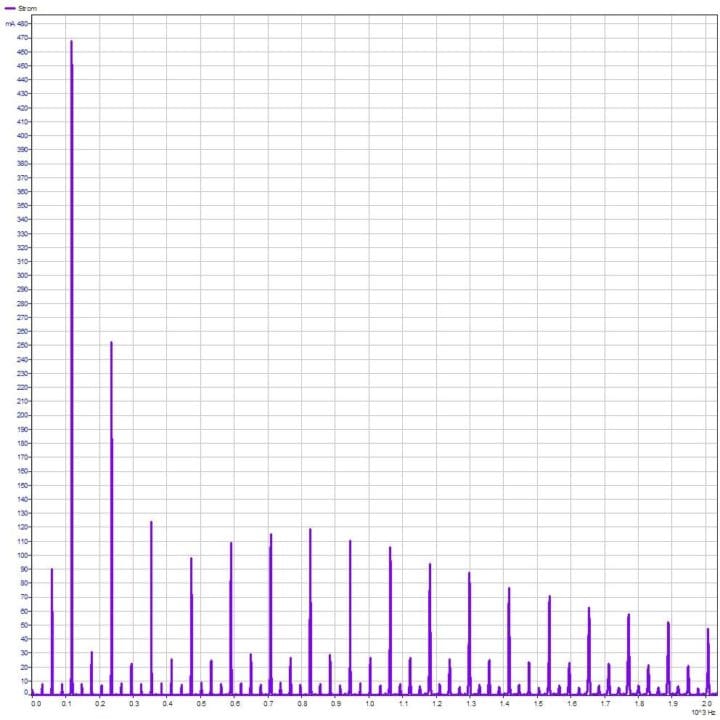
Accordingly, the spectrum of the current curve (Figure 2) shows its maximum occurs at 119 Hz. Assuming 3 commutations per revolution, this corresponds to a speed of 2380 revolutions per minute.
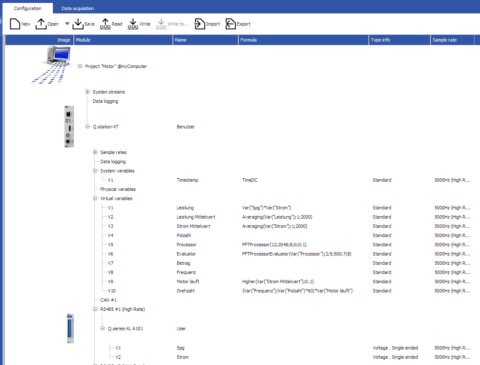
The spectrum can be performed both online and offline by Q.series X controllers. In this way, the engine speed can be determined continuously and live on the test bench using the current signal. The necessary configuration is performed in just a few steps.
Quick-and-Easy Configuration on the Test Bench
The FFT function of the Q.series X controller offers, among other things, the possibility to evaluate the maximum of a spectrum within a selected frequency band by magnitude and frequency. The frequency of the maximum corresponds to the fundamental wave and is divided by the number of poles and multiplied by 60 to give the speed in revolutions per minute (rpm). Also, the current is used to detect whether the motor is in operation and whether the electrical power can be calculated.
This edge computing allows the motor speed to be determined without a separate computer.
Depending on the test bench configuration, data can now be transferred to the system control, e.g., via EtherCAT or visualized within GI.bench on the test bench PC or over the local network.
Simply Powerful Visualization
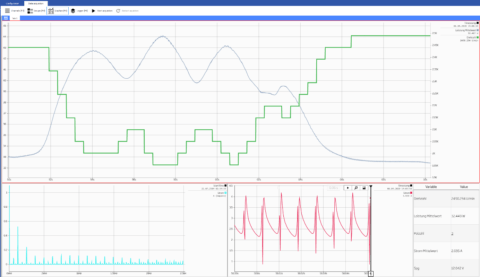
With GI.bench, you can create custom dashboards for visualization. Figure 4 shows the speed and power in the upper chart. When the motor is loaded, the speed decreases (green curve), while the power consumed increases (grey curve). Also, the current spectrum (blue), the current trace (red), and the parameters (table) are displayed numerically in this interface.
For references, demo programs and questions you can always contact us at info@gantner-instruments.com.
More articles
The Smarter E Europe
Join us at The Smarter E Europe in hall B5, stand no. 320. Our experts, Jörg Scholz and Jürgen Sutterlüti will be present and ready to address your questions.
Read more...GI-Team in Berlin
This year we decided to celebrate our annual summer party in Germany and traveled with almost all employees to Berlin on June 25. After a cozy evening at "Lembke's Spezialitäten Brauerei" we went sightseeing in Germany's capital on Sunday.
Read more...Seconds Matter: Real-Time Decisions for Smarter Energy Systems
The future of energy isn’t just about generating more power—it’s about using it smarter, faster, and more efficiently. The challenge? Energy systems are more complex than ever. Renewable integration, grid decentralization, and industrial energy demands are pushing operators to make split-second decisions that directly impact efficiency, stability, and cost.
Read more...Battery Show USA 2024
Curious about Gantner Instruments' latest innovations? See what we have in store for The Battery Show North America 2024!
Read more...